The tightest quote on the screen is rarely the cheapest fill in the account. Most brokerages still route A-book flow to whichever LP shows the best top-of-book price, then review performance once a quarter from a summary the LP itself supplies. That process hides the real cost of execution.
A serious liquidity provider comparison measures what happens after the order leaves the bridge: how long the LP holds it, how often it rejects, which direction slippage runs, and how much size it fills before the price moves. Those four numbers decide your markup capture, your client complaints, and a meaningful share of your churn.
This guide sets out a benchmarking framework that a risk desk or dealing team can run with data it already has.
What a Bad LP Actually Costs a Mid-Sized Broker
Consider an illustrative brokerage processing $3 billion in monthly FX and metals notional. It A-books 45% of that flow, so $1.35 billion reaches external liquidity each month. Two LPs sit behind the bridge.
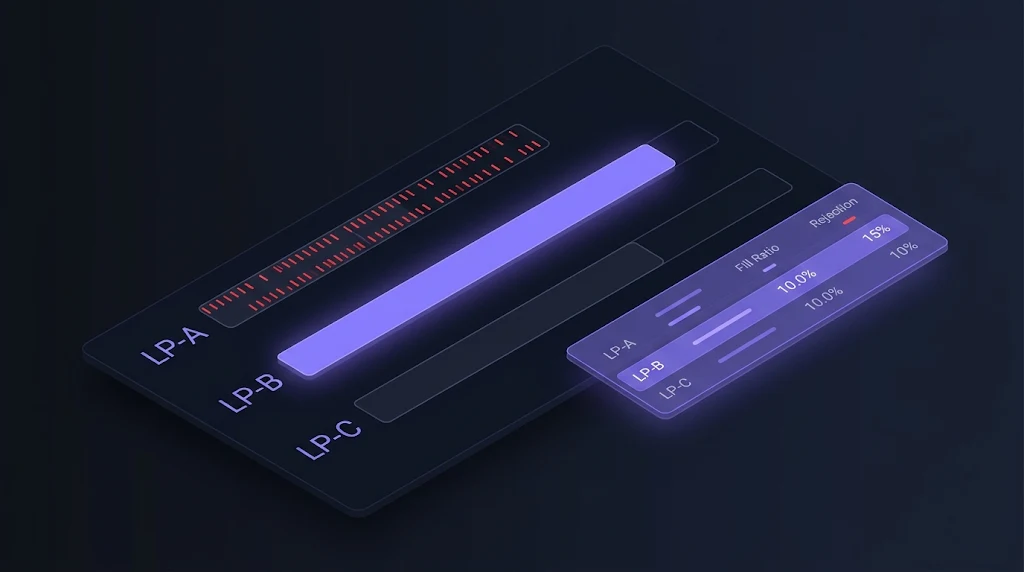
| Metric (EURUSD, illustrative) | LP-A | LP-B |
|---|---|---|
| Average quoted spread | 0.10 pip | 0.16 pip |
| Average effective spread after slippage | 0.26 pip | 0.18 pip |
| Reject rate | 4.1% | 0.6% |
| Median last-look hold time | 85 ms | 12 ms |
| Share of slippage that is negative | 72% | 51% |
Because LP-A shows the tighter quote, the routing logic sends it 70% of A-book flow, roughly $945 million a month. On EURUSD, one pip on $1 million notional is worth $100.
Spread leakage. The effective spread gap is 0.08 pip. On $945 million, that is 945 × 0.08 × $100 = $7,560 per month, or about $90,700 a year in markup the broker believes it is capturing but is not.
Rejection churn. Assume LP-A receives 60,000 orders a month. At 4.1% it rejects 2,460; at LP-B’s rate it would reject 360. The 2,100 excess rejections touch roughly 600 unique clients. If an illustrative 1% of those clients close their accounts each month, and each carries $2,500 in lifetime revenue, the loss is $15,000 per month, or $180,000 a year.
Combined, the “cheaper” LP costs this broker roughly $270,000 a year. None of it appears on an LP invoice, and none of it shows in a top-of-book quote comparison.
Why Quote-Based LP Selection Misleads Dealing Desks
Three structural factors explain why most brokers miss this.
Last look is invisible in quotes. An LP can stream an aggressive price because it reserves the right to reject or re-price the fill during its hold window. The quote is an option the LP grants itself. Longer hold times favour the LP whenever the market moves during the window.
LP reports are self-graded. Monthly execution summaries from a provider usually show averages. Averages hide asymmetry. A fill ratio of 97% looks healthy until it becomes clear that most rejections cluster in fast markets, exactly when clients notice.
Data lives in different systems. Order timestamps sit in the bridge, client complaints sit in the CRM, and P&L sits in the back office. Without a single dataset tagged by LP, no one can tie a rejection spike to a churn spike.
The result is a liquidity provider comparison built on the wrong inputs. Brokers end up rewarding the LP that looks best on a dashboard rather than the one that performs best on real flow.
Turning LP Benchmarking Into a Margin Lever
Reframed correctly, LP benchmarking stops being a compliance exercise and becomes a revenue control. Every basis point recovered on effective spread falls straight to the markup line. Every reduction in reject rate lowers support load and protects lifetime value.
There is also a negotiation dividend. LPs price relationships partly on the flow they receive and partly on how well the broker understands that flow. A dealing desk that arrives with per-session, per-symbol fill data has a far stronger hand than one quoting an average spread from a marketing sheet. Brokers that run a disciplined liquidity provider comparison every quarter tend to secure better tiering, tighter hold times, and clearer last-look terms.
Finally, benchmarking feeds routing. Once each LP has a measured profile, smart order routing can send each order to the venue most likely to fill it cleanly, not the venue with the prettiest quote. The smart order routing breakdown covers how that logic works inside a bridge.
Five Metrics Every Liquidity Provider Comparison Needs
Before building a process, agree on what a liquidity provider comparison should measure. These five metrics cover most of the economic impact.
1. Fill ratio and reject rate
Fill ratio is filled orders divided by orders sent. Track the inverse, the LP rejection rate, by symbol, order size bucket, and trading session. A provider with a 1% average reject rate that rises to 9% around data releases is a different counterparty from one that holds 1.5% all day.
2. Last-look hold time
Measure the time between order arrival at the LP and the fill or reject message. Report the median and the 95th percentile. A long tail matters more than the average, because the tail is where the market moves.
3. Effective spread versus quoted spread
Effective spread is the actual fill price relative to the mid at order send. Comparing it with the quoted spread shows how much of the advertised tightness survives contact with real flow. This is the single most useful number in any liquidity provider comparison.
4. Slippage symmetry
Healthy liquidity produces roughly balanced positive and negative slippage. A provider that passes on negative slippage but rarely positive slippage is extracting value silently. Track the ratio, not just the average.
5. Depth at size
Top-of-book depth is often $1 million or less. Measure how far the price moves to fill $5 million or $10 million against each LP’s ladder. For brokers with professional or institutional segments, this metric frequently decides which LP should carry large tickets.
Supporting metrics include price update frequency, stale-quote incidents, session disconnects, and behaviour during rollover. These belong in the scorecard but rarely move the economics as much as the five above.
How to Run an LP Benchmark: An Operator’s Playbook
The following steps assume a bridge or aggregator that timestamps orders and tags each fill with the LP identifier.
Step 1: Define the test window
Run the liquidity provider comparison over at least four consecutive weeks. Include a major data release, a month-end, and several rollover windows. Shorter samples overweight calm markets and flatter every provider.
Step 2: Normalise the dataset
Bucket orders by symbol, size, session, and volatility regime. Compare LPs only within the same bucket. A provider that mainly receives Asian-session EURUSD flow cannot be judged against one that receives London-open gold.
Step 3: Build a weighted scorecard
Assign weights that reflect the brokerage’s model. An illustrative weighting for a hybrid A/B-book broker:
| Metric | Weight |
|---|---|
| Effective spread | 30% |
| Reject rate | 25% |
| Last-look hold time (p95) | 20% |
| Slippage symmetry | 15% |
| Depth at size | 10% |
Score each LP from 1 to 10 on each metric within each bucket, then calculate the weighted total. The output is a per-bucket ranking, not a single winner.
Step 4: Run controlled allocation
Shift a fixed share of flow, for example 10% to 20%, between LPs for two weeks and measure the change. This confirms that scorecard differences hold under live conditions and are not artefacts of different flow mixes.
Step 5: Translate results into routing rules
Move the evidence into the bridge. Route large tickets to the LP with the best depth at size. Route fast-market flow away from long-hold providers. Set automatic failover if an LP’s reject rate breaches a threshold intraday. The bridging product supports rule-based routing and failover at this level of detail.
Step 6: Renegotiate and repeat quarterly
Share the relevant metrics with each LP and request specific changes: shorter hold windows, symmetric slippage, revised tiering. Then rerun the benchmark the following quarter. A liquidity provider comparison is a recurring control, not a one-off audit.
LP Benchmarking · Execution Analytics
Is your tightest LP quietly your most expensive one?
Fill ratio · Last look · Effective spread · Depth at size
Where Benchmarking Breaks Down Without the Right Stack
Most brokers who attempt this exercise stall at Step 2. The data exists, but it sits across a bridge log, a platform server, and a spreadsheet. Analysts spend weeks reconciling timestamps instead of acting on results.
Three capabilities remove that bottleneck.
Unified execution analytics. Every order should carry the LP tag, send time, fill time, and mid-at-send in one record. Liquidity aggregation with built-in execution analytics reports fill rates, slippage, and LP performance in the same place the routing happens.
A price engine that controls what clients see. Benchmark results only pay off if the client-facing price reflects the true cost of liquidity. A dedicated price engine lets the desk set markups by tier, symbol, and session based on measured effective spread rather than quoted spread.
Risk tooling that links flow to exposure. Rejections and slippage interact with A/B-book decisions. The risk management suite connects routing outcomes to exposure, so a change in LP allocation does not create blind spots on the B-book side.
Context matters too. Brokers comparing a prime-of-prime relationship against direct bank access should read the breakdown of how prime-of-prime liquidity works. Those still settling their execution model should start with STP vs ECN vs market maker.
Building Benchmarking Into the Infrastructure Layer
The scale of the market keeps raising the stakes. Global FX turnover reached $9.6 trillion per day in April 2025, up 28% from 2022, according to the BIS Triennial Survey. More volume means more LPs competing for broker flow, and more variation between them. Brokers that can measure that variation are the ones that capture it.
SpencerLogic treats LP benchmarking as a property of the stack rather than a project. Aggregation, bridging, pricing, and risk run on shared data, so a liquidity provider comparison is a report the desk opens, not a dataset it assembles. Brokers can adopt the components they need: aggregation for a multi-LP setup, a bridge for MT4/MT5 connectivity, or the full stack alongside Spencer Trader as an all-in-one white label brokerage solution. White-label deployment typically takes days to one or two weeks, compared with the months a custom build requires.
Want to see how your current LPs actually score? Book a demo and get a benchmark of your execution data mapped in 30 minutes.
Conclusion: Start With One Symbol and Four Weeks
A full LP benchmark sounds heavy, but it does not need to start that way. Pick the highest-volume symbol, tag every order by LP for four weeks, and calculate effective spread and reject rate. Those two numbers alone usually justify the next step.
From there, add the remaining metrics, build the weighted scorecard, and move the results into routing rules. Each quarter, the liquidity provider comparison gets sharper and the negotiation position gets stronger.
The brokers with the best execution are rarely the ones with the most LPs. They are the ones that know exactly what each LP delivers. To map your current stack and identify the fastest gains, book a SpencerLogic demo.
FAQ
What is the most important metric in a liquidity provider comparison?
Effective spread is the most useful single metric. It measures the actual fill price against the mid at order send, so it captures quoted spread, slippage, and re-pricing in one number. Quoted spread alone overstates how cheap aggressive LPs really are.
What is an acceptable LP rejection rate for an FX broker?
There is no universal threshold, and it depends on flow type and session. Industry-reported figures for retail flow on major pairs often sit in the low single digits. The more important test is consistency: a rate that spikes sharply during news events signals last-look behaviour worth renegotiating.
How does last look affect broker execution costs?
Last look gives the LP a window to accept, reject, or re-price an order after it arrives. Longer hold times let the LP decline trades when the market moves against it. The broker absorbs the result through rejections, worse fills, and client complaints.
How long should an LP benchmark test run?
Four weeks is a practical minimum. The sample should include a major data release, a month-end, and several rollover periods. Shorter windows overweight calm conditions and make most providers look similar.
Can a broker benchmark LPs without changing its bridge?
Partially. Any bridge that logs timestamps and LP identifiers can support a basic benchmark through exported data. Continuous benchmarking and automated routing changes require a bridge or aggregator with built-in execution analytics.
Should brokers use a single LP or several?
Most mid-sized brokers benefit from at least two or three LPs behind an aggregator. Multiple providers create failover protection and let routing rules send each order type to the best-performing venue. Benchmarking is what makes a multi-LP setup pay off.
How often should brokers renegotiate LP terms?
A quarterly review cycle works well. Each cycle should produce a scorecard, a short list of requested changes for each LP, and updated routing rules. Annual reviews are too infrequent to catch drift in hold times or rejection patterns.